DevTools
Track down layout, hit-testing, rendering and performance issues with a one-line overlay, a standalone panel and a bounded, structured Console.
In-window inspector
During development, attach the overlay to your root. On hover it outlines the node’s rect with a dashed box and shows its size and component name. The overlay is pass-through (it doesn’t intercept clicks or scrolling), and hovering only triggers paint-level updates, never a relayout.
fn mountUi(cx: *ui.Cx, scope: *ui.Scope) anyerror!*ui.Node {
    const root = try mountProductUi(cx, scope);

    // Development only: hover highlight with size + component name.
    _ = try ui.devtools.overlay.attach(cx, scope, root, .{});
    return root;
}
The overlay’s state lives on the scope you pass; when that Scope is disposed, the overlay goes with it. Use it in the product window to answer “who owns this space?”; use the panel for full diagnostics. Both read the real Node / Cx state, so there is no mirror model to maintain for debugging.
Diagnose by symptom
hit_behaviorsetText / setTextContent? Those APIs compare and mark sizing / render dirty themselvesnode.style directly marks nothing dirty; use node.setStyle(alloc, .width, v), which picks the right dirty level per fieldThe DevTools panel
For the full Elements, Components, Console and Performance views, use ui.devtools.mountPanel(cx, target, opts). The panel has its own Cx and observes a separate target Cx; the usual setup puts it in its own window with MultiWindowApp so it never covers the product UI. The target must stay alive while the panel is in use.
const std = @import("std");
const ui = @import("ui");
const zenit_app = @import("zenit_app");

// mountProductUi: your app's ordinary mount function (see above).
var g_target_cx: ?*ui.Cx = null;

fn mountDevTools(cx: *ui.Cx, scope: *ui.Scope) anyerror!*ui.Node {
    _ = scope;
    const target = g_target_cx orelse return error.TargetNotReady;
    return ui.devtools.mountPanel(cx, target, .{ .title = "My App DevTools" });
}

pub fn main() !void {
    var gpa = std.heap.GeneralPurposeAllocator(.{}){};
    defer _ = gpa.deinit();

    var application = zenit_app.MultiWindowApp.init(gpa.allocator(), .{});
    defer application.deinit();

    const product = try application.createWindowWith(.{
        .window = .{ .width = 900, .height = 640, .title = "My App" },
    }, mountProductUi);
    g_target_cx = product.cx;

    const tools = try application.createWindowWith(.{
        .window = .{ .width = 760, .height = 560, .title = "DevTools" },
    }, mountDevTools);
    _ = ui.devtools.setViewMode(tools.cx, "performance"); // optional start tab

    try application.run();
}
This is how the repo’s zig build devtools-probe is structured. ui.devtools also exposes setViewMode, setTreeFilter, setConsoleFilter and friends so probes and E2E tests can drive the panel programmatically.
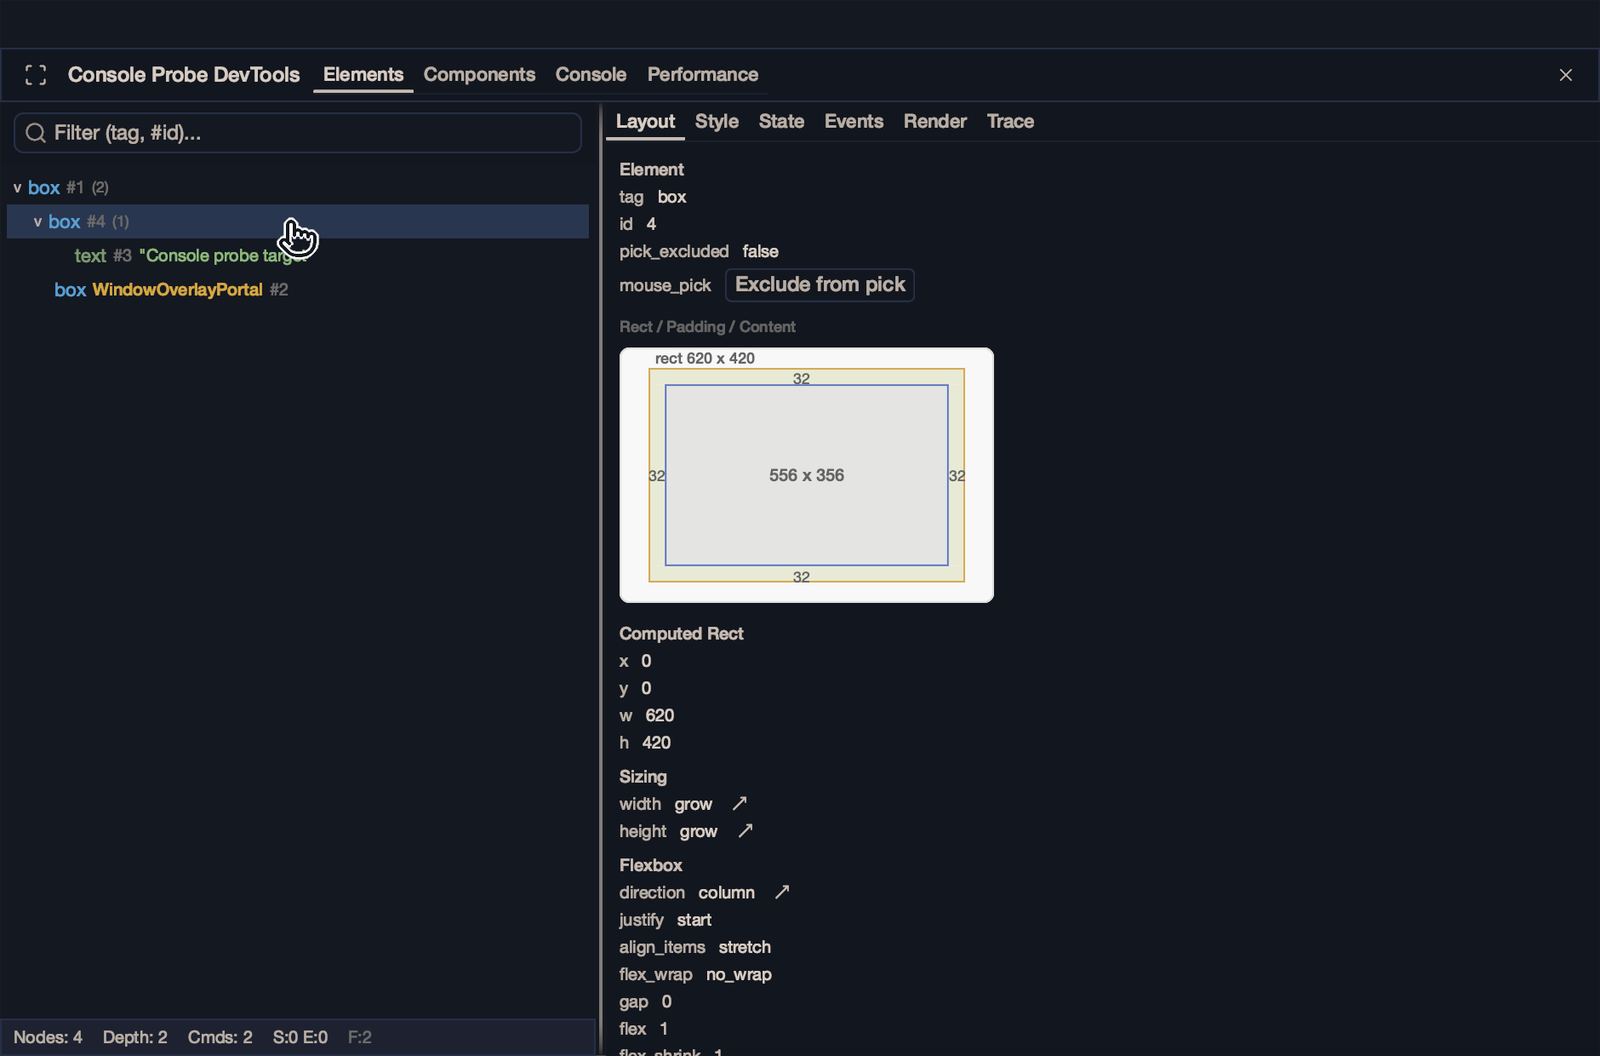
Four views, six detail tabs
With an Elements / Components row selected, switch between Layout, Style, State, Events, Render and Trace. Some Style values are live-editable; Render / Trace show why a node went dirty and its recent events. Tree search matches tags, #id and component names. With ui.devtools.source_link configured, component rows can jump to their definition in your editor.
Console logging
Every ui.Cx owns a thread-safe, bounded Console. One call can print to the terminal and keep a structured event for DevTools and the E2E harness; history captured before the panel opened shows up too.
const log = cx.console();

log.info("application ready", .{});
log.scoped("network").warn("retry {d}", .{attempt});

// Plain level methods don't record a call site; writeAt does.
log.writeAt(.err, @src(), "save failed: {s}", .{@errorName(err)});
Levels are debug, log, info, warn and err. Browser-console counterparts are there too: group / groupEnd, count, time / timeEnd, assert, trace, inspect and table.
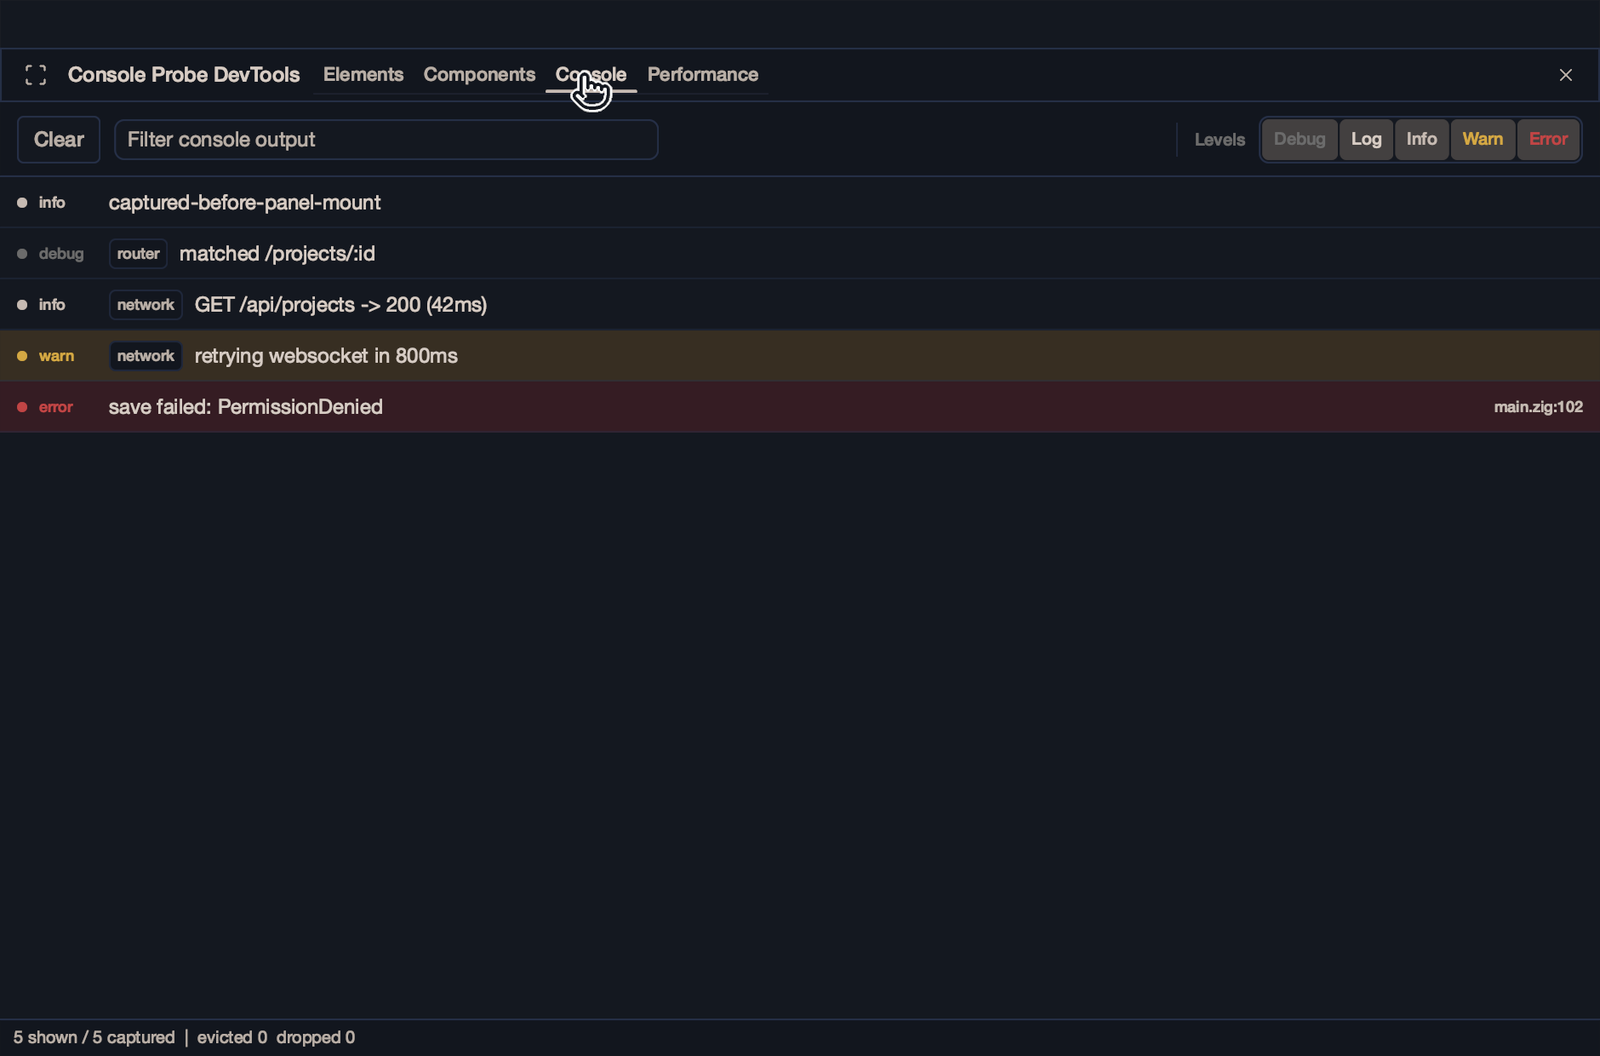
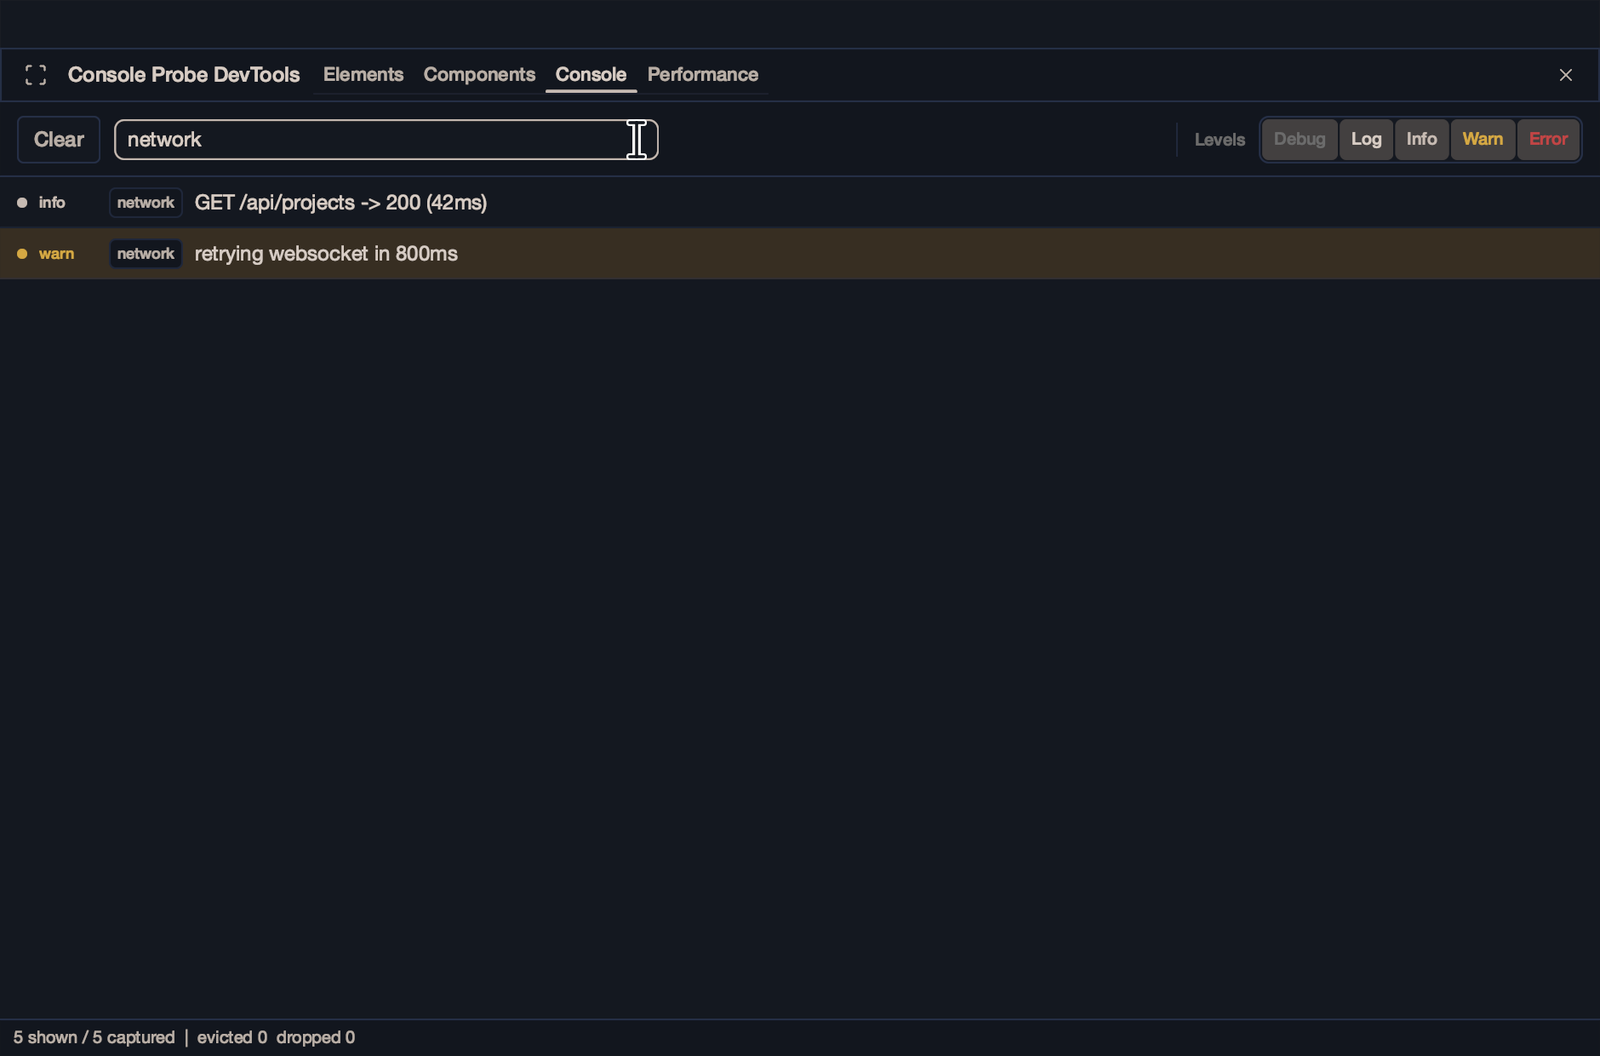
Plain level methods don’t record a call site. To click a log line and land in your editor, use writeAt(level, @src(), …) and set the source root and editor command with ui.devtools.source_link.configure (default: code --goto).
Configuring capture
const app = try zenit_app.App.init(allocator, .{
    .console = .{
        .terminal_level = .info, // null disables the terminal sink
        .capture_level = .debug, // null disables in-memory capture
        .max_entries = 10_000,
        .max_bytes = 8 * 1024 * 1024,
        .max_entry_bytes = 64 * 1024,
    },
});
Without an explicit console, zenit_app picks defaults by build mode:
Debug.debug.debugReleaseSafe.info.infoReleaseFast / ReleaseSmall.warnnull (off)The Console mirrors the browser console’s capture-and-view side; it is not a Zig / JavaScript REPL. Groups currently indent but can’t be collapsed interactively, and table falls back to text. The full API, threading and lifetime rules, and harness examples are in the repo’s docs/CONSOLE.md.
Performance: idle vs. stuck
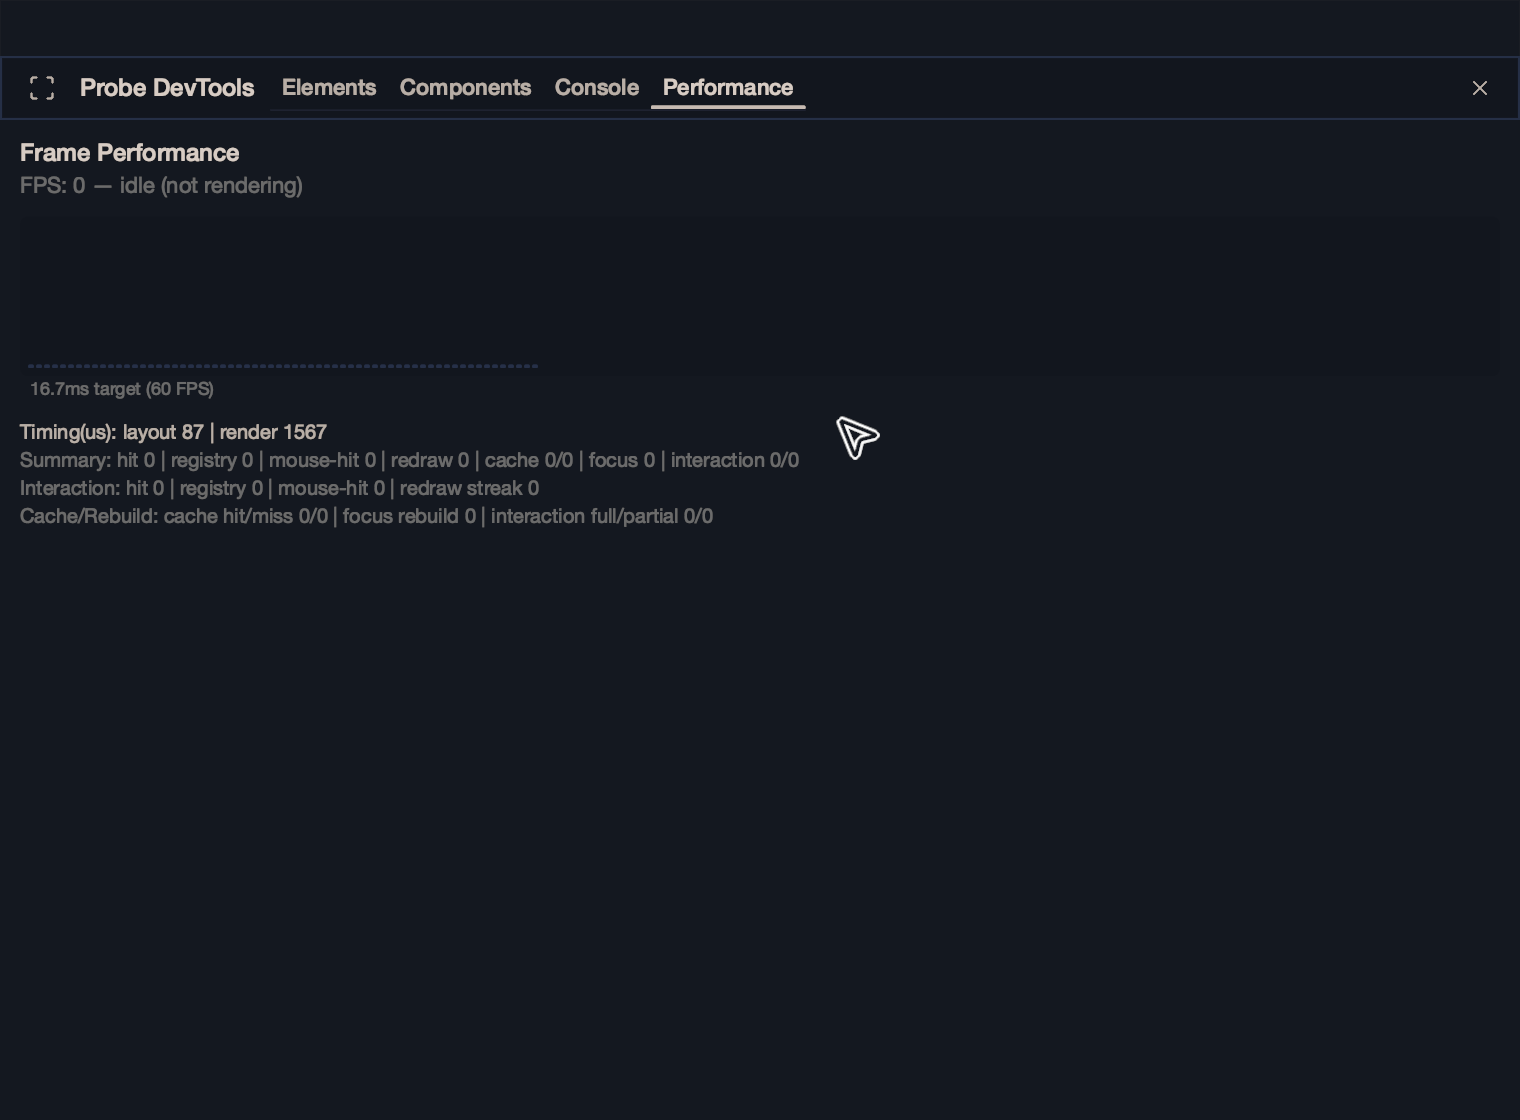
The Performance view doesn’t freeze on “the last N rendered frames”. It keeps observing the target in 100 ms wall-clock buckets (64 of them, a rolling window of about 6.4 s) and computes FPS as the mean of the last 10 buckets (about 1 s). When the target produces no frame for more than 0.7 s, the readout says FPS: idle (rendering minimized). When nothing changes, the framework lowers the frame rate as far as it can to save power; this is not a stall.
Test entry points
zig build test-headless
zig build test-ui
zig build test-render
zig build hello-buttonBefore release
- ✓
Turn off debug UI. Remove the inspector overlay, or gate it behind a debug-only config.
- ✓
Verify input in a real window. Keyboard, IME, clipboard and VoiceOver.
- ✓
Run the build gates. The headless, UI and render test steps.
- ✓
Check the Console policy. Release terminal level and capture are what you intend, and logs carry no sensitive data.
- ✓
Pin versions. Lock the Zenit revision and record the target Zig version.